Written by Howard Yeh
Co-Founder, Chief Revenue Officer, Founding CEO at HealthCare.com
We want to help you make educated healthcare decisions. While this post may have links to lead generation forms, this won’t influence our writing. We adhere to strict editorial standards to provide the most accurate and unbiased information.
Key findings
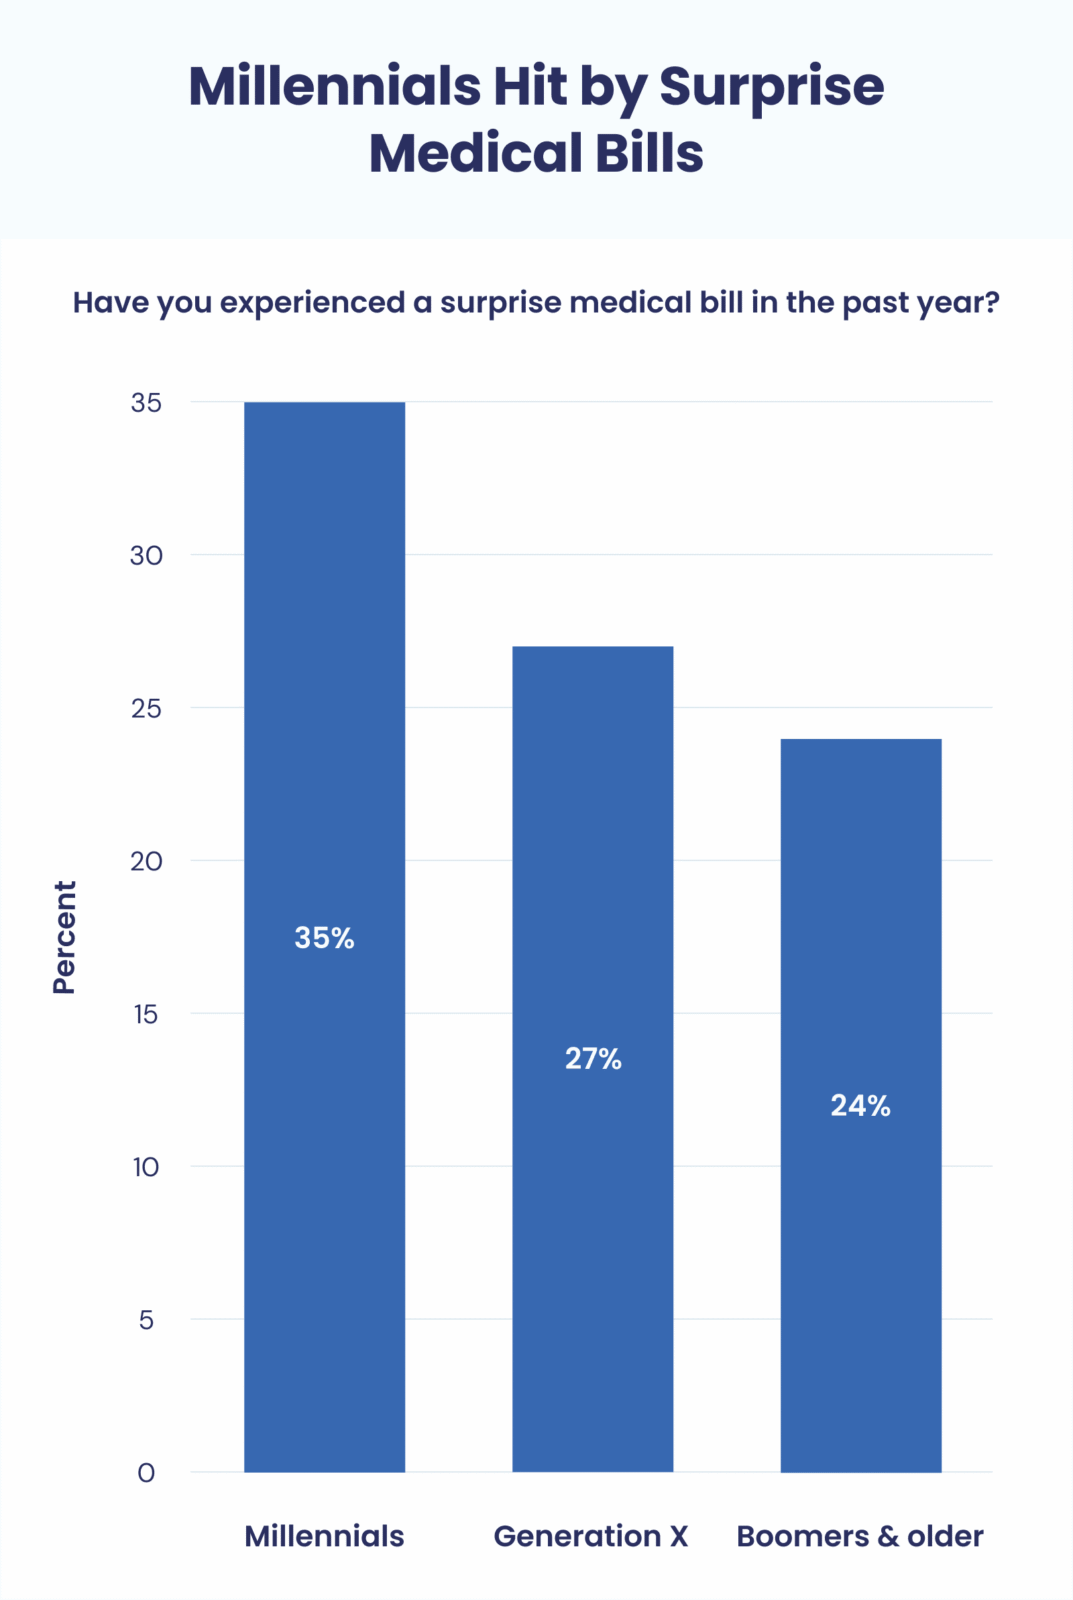
- More than one-third (35%) of Millennials (18-34 year olds) have experienced a surprise medical bill in the past year (since October 2019).
- More than half (51%) of Millennials who reported a surprise bill said it was over $2,000.
- Nearly six in ten (57%) Millennials said they have $3,000 or less in savings they could use to pay medical bills (including 22% who indicated they have none).
Millennials are more likely to report surprise medical bills than Generation X or Baby Boomers.
And when they do, they have less in the bank to pay their bills.
More than one-third (35%) of Millennials responding to a new survey cited a surprise medical bill in the last 12 months.
That compares to just 27% of Generation X and 24% of Baby Boomer and older respondents.
The data from the new poll by HealthCareInsider.com paints a troubling picture of healthcare finances among Millennials.
More than half (51%) of Millennials who reported a surprise bill said it was over $2,000.
That’s well more than the 41% of Gen X (35-54 year olds) and 33% of Baby Boomers and older respondents (55+) who said the bill was more than $2,000.
Less in the bank
Despite reporting more surprise medical bills, Millennials had less in the bank to pay healthcare costs.
57% of Millennials said they have $3,000 or less in savings (including 22% with none) to settle medical bills.
Gen X and Baby Boomer and older respondents were less worse off, with 53% of the former and 42% of the latter reporting $3,000 or less in savings.
Conversely, 20% of Millennials, 27% of Gen X and 34% of Baby Boomers and older pollees said they have over $3,000 to pay medical bills.
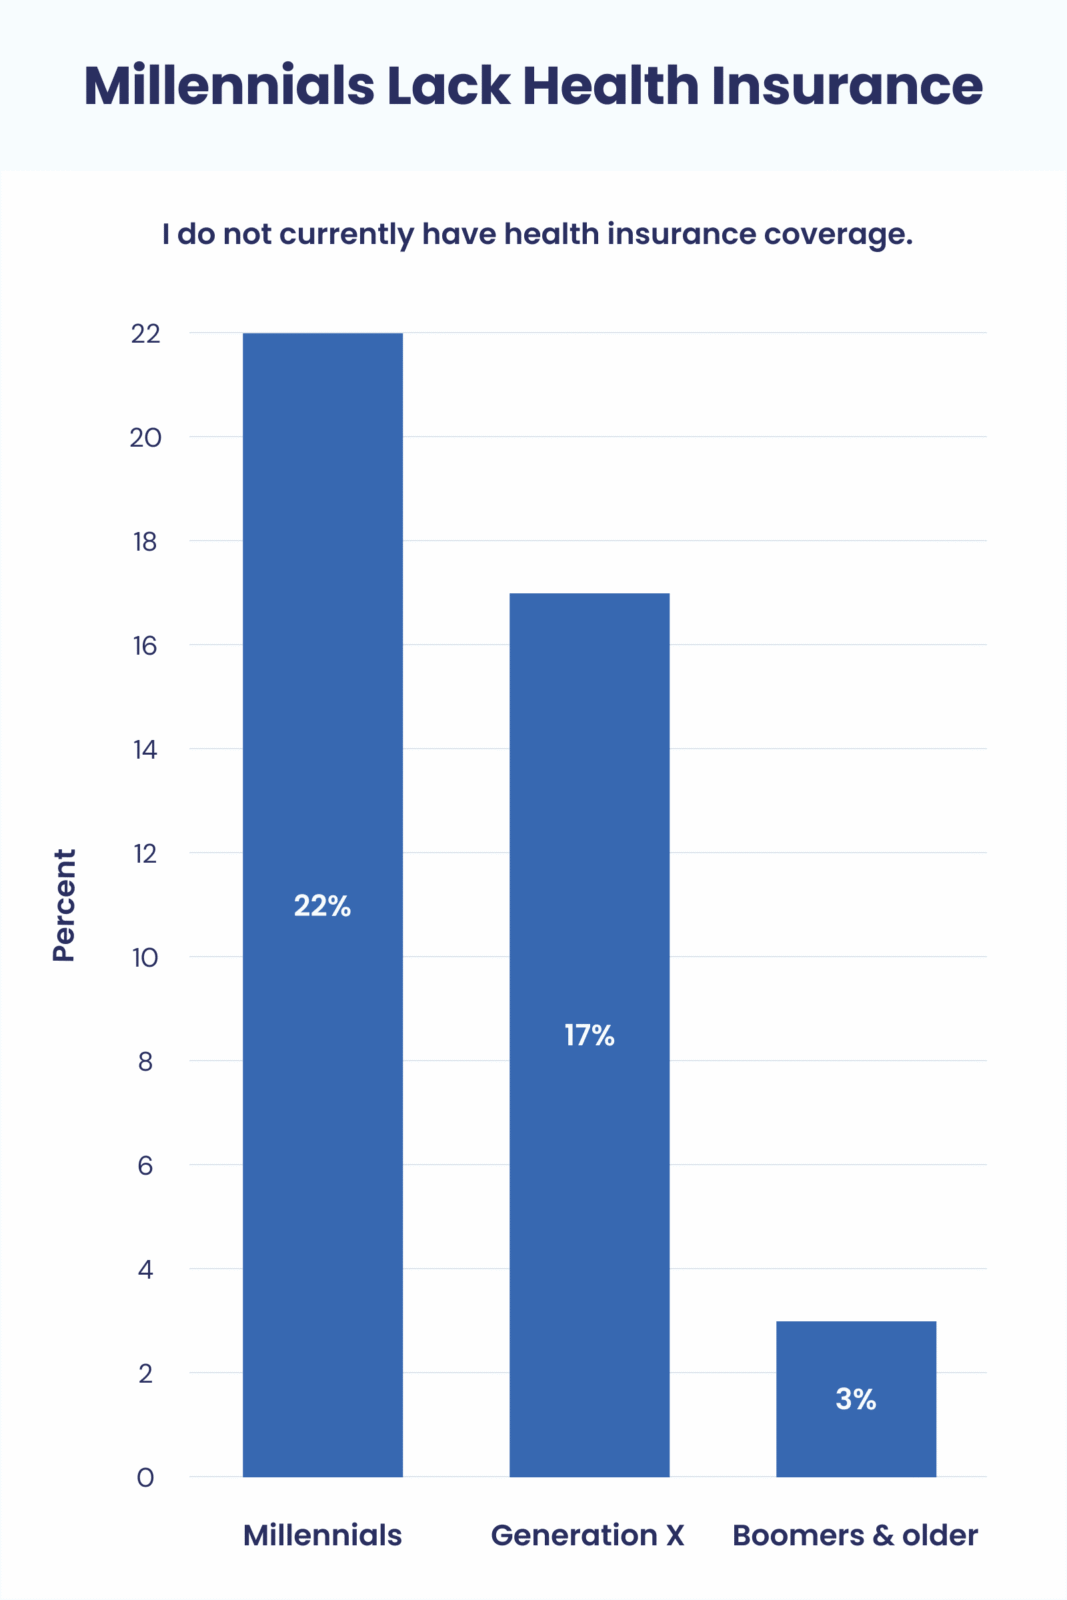
When it comes to covering their bills, Millennials are also less likely to have health insurance, and when they do, to consume it differently.
22% of Millennials said they don’t have health insurance.
That compares to 17% of Gen X and 3% of Baby Boomers and older respondents (who may have Medicare).
Meanwhile, just 28% of Millennials said they get their primary health insurance through their employer.
46% of Gen X and 25% of Baby Boomers and older generations do so.
On the other hand, 13% of Millennial respondents said they get their primary health insurance directly from an insurance company, compared to just 5% of Gen X and 4% of Baby Boomers and above.
Asked which political party they trust more to ensure they and their family can obtain affordable healthcare, Millennials were more likely to place trust in the Democratic (39%) than Republican (15%) party.
But they also expressed more trust in independents than Generation X or Baby Boomer and older pollees.
20% of Millennials, 12% of Gen X and 6% of Baby Boomers and above most trusted independents to ensure they and their family can obtain affordable healthcare.
Meanwhile, 39% of Millennials, 45% of Gen X and 47% of Baby Boomer and older respondents most trusted the Democratic Party to do so.
15% of Millennials, 24% of Gen X and 41% of Baby Boomers and older folks most trusted the Republican Party to ensure they and their family can obtain affordable health care.
“The health insurance landscape is most likely going to change in the coming year. It’s important for Millennials and others to make sure they have health insurance to help avoid unexpected medical costs,” said Jeff Smedsrud, co-founder of HealthCare.com.
“Nearly 90% of Americans who enroll on the federal or state Marketplaces qualify for a subsidy to reduce the monthly cost of health insurance, so it pays to investigate whether you qualify or if other affordable options exist.”
Minorities Challenged by Healthcare Costs
HealthCareInsider’s survey also shows minorities facing bigger pocketbook challenges than Whites among the US adults aged 18+ who took part.
One in four (25%) Hispanics, nearly one in five (18%) respondents choosing Other, and roughly one in seven (15%) Blacks reported not having health insurance.
That compares to less than one in ten (9%) Whites.
Blacks were most prone among racial groups to report medical debt.
37% of Blacks, 29% of pollees choosing Other, 28% of Hispanics and 26% of Whites said they have medical debt.
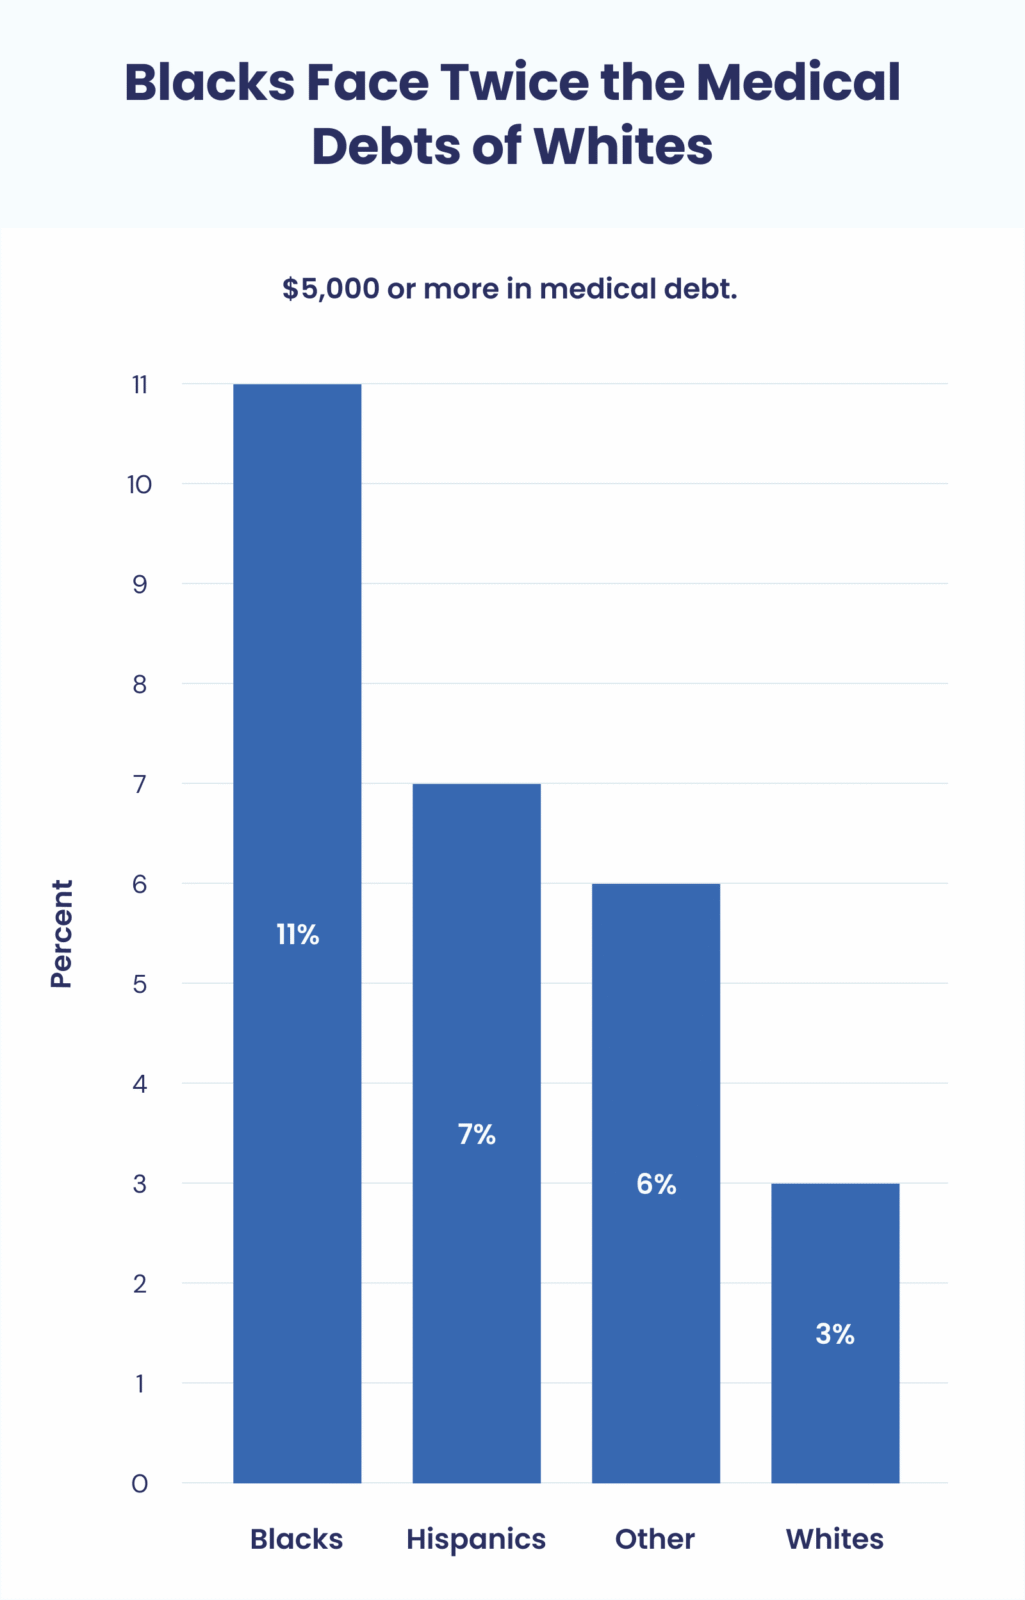
Blacks also reported medical debts of over $5,000 at more than twice the rate of Whites.
In total, 11% of Blacks compared to 5% of Whites cited medical debts of more than $5,000.
Meanwhile, 7% of Hispanics and 6% of those selecting Other said their medical debt is over $5,000.
Minorities were also less well positioned to settle their healthcare bills.
Just 47% of those choosing Other, 48% of Black and 51% of Hispanics said they have savings for medical costs.
That compares to 61% of Whites.
More Southerners Report Medical Debt
HealthCareInsider’s new survey also turned up significant regional disparities in health insurance coverage and preparedness to pay medical bills.
Respondents from the South were both more likely to say they don’t have health insurance and more prone to report medical debt.
16% of U.S. adults aged 18+ in the South said they don’t have health insurance.
That compares to 12% in the Northeast, 8% of people in the Midwest, and 14% of people in the West.
Meanwhile 33% of respondents in the South reported medical debt, compared to 28% of people in the Northeast, 27% in the Midwest, and 22% of people in the West.
10% of pollees in the South said the amount is more than $5,000, compared to 4% of people in the Northeast, 6% in the Midwest, and 3% of people in the West.
Methodology
HealthCareInsider.com commissioned YouGov Plc to conduct the survey. All figures, unless otherwise stated, are from YouGov Plc. The total sample size was 1,414 adults. Fieldwork was undertaken October 19-20, 2020. The survey was carried out online. The figures have been weighted and are representative of all U.S. adults (aged 18+). The margin of error is 2.6% plus or minus.
Prescription Savings Made Simple
Save at over 80,000 pharmacies nationwide with CareCard.
Get Started