Written by Michael LaPick
Healthcare Writer
We want to help you make educated healthcare decisions. While this post may have links to lead generation forms, this won’t influence our writing. We adhere to strict editorial standards to provide the most accurate and unbiased information.
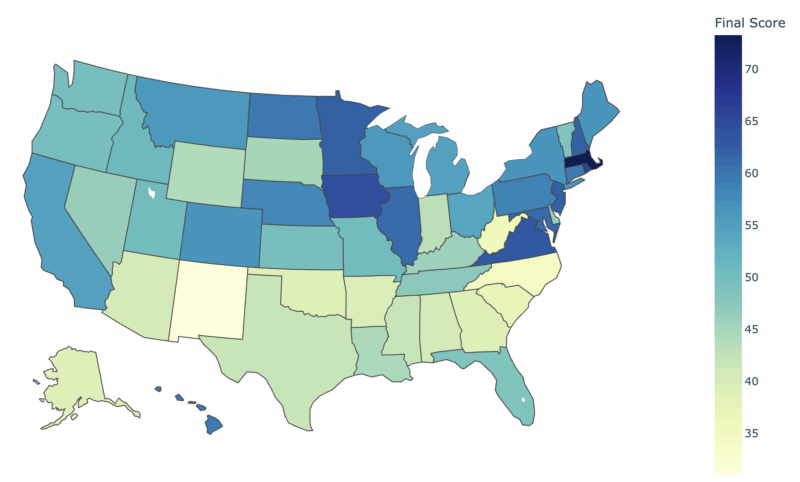
Healthcare in America’s biggest cities matters more than ever as urban living becomes the norm, but the quality, cost, and accessibility of care vary dramatically depending on where you live. From Los Angeles to New York City, HealthCare Insider analyzed the 20 most populous metro areas to determine which cities offer the best healthcare experiences across key metrics.
Explore the map, chart, and table below to see how your city compares on healthcare cost, access, and quality.
Click HERE to start your health plan journey now.
An ER visit can cost five times more in San Francisco than in Minneapolis, while Boston and Philadelphia shine for access to healthcare workers and preventive care, and cities like Detroit and Miami lag in everything from life expectancy to patient satisfaction.
Cities With The Best Healthcare
| Metro | Rank | Score | Cost | Access | Quality |
|---|---|---|---|---|---|
| Boston | 1 | 78.13 | 23.09 | 27.20 | 27.85 |
| Minneapolis-St. Paul | 2 | 68.77 | 21.42 | 21.65 | 25.70 |
| Philadelphia | 3 | 61.19 | 21.42 | 25.25 | 14.52 |
| Baltimore | 4 | 60.84 | 28.08 | 21.09 | 11.66 |
| Seattle | 5 | 59.73 | 14.52 | 16.65 | 28.56 |
| Phoenix | 6 | 58.85 | 21.90 | 20.54 | 16.42 |
| San Diego | 7 | 58.38 | 14.28 | 17.21 | 26.89 |
| Denver | 8 | 57.35 | 18.33 | 14.99 | 24.04 |
| Chicago | 9 | 52.87 | 21.18 | 16.93 | 14.76 |
| Tampa | 10 | 52.55 | 16.42 | 18.04 | 18.09 |
| Washington D.C. | 11 | 51.48 | 17.37 | 13.88 | 20.23 |
| Los Angeles | 12 | 51.24 | 12.85 | 18.87 | 19.52 |
| New York | 13 | 50.28 | 11.90 | 22.20 | 16.18 |
| Detroit | 14 | 47.03 | 19.75 | 21.09 | 6.19 |
| Miami | 15 | 46.64 | 18.56 | 18.32 | 9.76 |
| San Francisco | 16 | 46.60 | 4.52 | 14.71 | 27.37 |
| Houston | 17 | 41.68 | 16.66 | 13.60 | 11.42 |
| Riverside-San Bernardino | 18 | 41.29 | 14.52 | 12.49 | 14.28 |
| Atlanta | 19 | 38.43 | 19.28 | 7.49 | 11.66 |
| Dallas | 20 | 37.32 | 16.18 | 8.05 | 13.09 |
ACCESS
- Hospital Beds Per 1000 People
Best City: San Diego
Worst City: Washington D.C. - Nurses Per 1,000 Jobs
Best City: Philadelphia
Worst City: Washington D.C. - Surgeons Per 1,000 People
Best City: Boston
Worst City: Atlanta - Mental Health And Substance Abuse Social Workers Per 1,000 Jobs
Best City: Boston
Worst City: Houston and Atlanta tie - Total Healthcare Workers Per 1,000 Jobs
Best City: Philadelphia
Worst City: San Francisco - Visits To Dentist Or Dental Clinic In The Previous Year Among Adults Aged 18+ (%)
Best City: Seattle
Worst City: Detroit and Dallas tie
QUALITY
- Hospital Satisfaction: Patient Ratings (1-5)
Best City: Dallas
Worst City: Miami - Percent Receiving Preventive Services 65+
Best City: Washington D.C.
Worst City: New York - Percent Receiving Adequate Prenatal Care
Best City: San Francisco
Worst City: Houston - Life Expectancy
Best City: San Francisco
Worst City: Detroit - Percent Uninsured
Best City: Boston
Worst City: Dallas - COVID Local Risk
Best City: Seattle
Worst City: Detroit and Miami tie - Cardiovascular Deaths Per 100,000
Best City: Boston
Worst City: Miami
COST
- Insurance Premium (average ACA silver plan)
Best City: Atlanta
Worst City: Washington D.C. - Healthcare Cost Index (*average healthcare service prices compared to the national average)
Best City: Baltimore
Worst City: San Francisco - Angioplasty (open blocked coronary arteries)
Best City: Riverside-San Bernardino
Worst City: New York - Ambulance Transportation
Best City: Baltimore
Worst City: Dallas - Emergency Department Visit
Best City: Minneapolis-St. Paul
Worst City: San Francisco - Simple Dental Cleaning
Best City: Boston
Worst City: New York - Average Colonoscopy
Best City: Chicago
Worst City: San Francisco
Methodology
In order to determine which most populous U.S. cities offers the best healthcare, HealthCareInsider compared 20 urban areas across three categories: 1) Cost, 2) Access, and 3) Quality.
We evaluated these categories using the 20 measures below. For each measure, cities were graded on a 100-point scale. A score of 100 represented the best performance.
Lastly, we added each metro’s score across all measures to rank America’s 20 top cities.
Sources: Data used to create this ranking were collected from the U.S. Bureau of Labor Statistics, Centers for Medicare & Medicaid Services, United States Census Bureau, NYU Langone Health City Health Dashboard, Kaiser Family Foundation (KFF), FAIR Health, Turquoise Health, and HealthCare.com research.
Thank you for your feedback!


